Redéfinir la satisfaction professionnelle
Performance, épanouissement de l’employé et pratiques de leadership
Executive Summary
Now, more than ever, organisations need to engage employees. Rapid market change, disruptive technologies and opportunities available to your key talent have forced organisations to re-examine the connections between business performance, leadership and employee satisfaction.
Over the past several years, many organisations have focused on reigning in key financial indicators. By searching the global labour market for the most efficient resources, creating process improvements and using technology to speed up operations, companies have improved financial performance and created competitive advantages. But downsizing, outsourcing and off-shoring will soon reach upper limits on their ability to improve organisational performance. In addition, these actions are available to all competitors—making them, at best, temporary sources of competitive advantage.
So, where will the next force for performance improvement come from? Where can organisations find sources of sustainable (not temporary) competitive advantage? In a series of 14 individual studies, Wilson Learning Worldwide has found one answer—Fulfilment Satisfaction. Our research has repeatedly shown that there is a direct correlation between employee Fulfilment Satisfaction and job performance. These studies have shown that, on average, 39% of the workforce bottom line can be attributed to employee Fulfilment Satisfaction.
This research could not be more timely. A Gallup poll showed that 55% of employees say they are not engaged in their work, and turnover among executives and managers is at an all-time high (SHRM research). Furthermore, our research has clarified the greatest source of employee fulfilment. The single most important factor in creating a sense of fulfilment is the leadership skills of an employee's manager. This finding has significant implications for the importance of the role of the manager and how effective he or she is in creating Fulfilment Satisfaction.
Redefining Satisfaction
Employee satisfaction means different things to different people. While we intuitively believe that employee satisfaction is necessary for high performance, studies in the past have not supported this belief. Several years ago, Wilson Learning Worldwide began asking why and concluded that the problem was in the definition of satisfaction.
The dictionary defines satisfaction as "gratification of an appetite and pleasure." In general, people most often associate satisfaction with happiness and comfort. It is likely that in most of the previous studies, people responded to the question "Are you satisfied?" by interpreting the question as "Are you comfortable in your work? Do you feel secure and content?" While this may not have been the intent of the question, this understanding of the question does suggest why organisational performance has not been linked statistically to employee satisfaction. We don't often associate high performance with contentment, security and comfort.
However, we do tend to associate high performance with enjoyment of the work, fulfilment in accomplishment and effective work relationships. Therefore, the researchers at Wilson Learning Worldwide decided to explore a new definition of satisfaction, one that taps the elements of fulfilment, empowerment and engagement. In the process, we have identified a powerful tool for creating a high-performance, high-fulfilment work environment.
Fulfilment Satisfaction
We call our approach "Fulfilment Satisfaction" (or just "fulfilment") to differentiate it from the traditional definition of satisfaction (that is, satisfaction as being comfortable). It is our belief that if you can identify and measure a more meaningful definition of satisfaction, you will find a closer causal relationship to organisational performance. We began our research by identifying the principal elements of fulfilment, empowerment and engagement. We identified five principal elements:
- Satisfaction with the job: To be fulfilled, people need to value their day-to-day work activities. People need to have a sense of accomplishment or pleasure from the work itself.
- Satisfaction with relationships: People also need to value the relationships they have on the job to be fulfilled. People want to like working with their co-workers. While people know that conflicts will arise, they want to be assured that the focus is not on the interpersonal differences, but the task differences.
- Satisfaction with leadership: If people do not think they are being managed or led effectively, it is hard to have fulfilment in the work.
- Knowing that others are satisfied in their work: One of the key findings from our research is the importance of the open expression of fulfilment in the workplace. Knowing that others gain fulfilment in their work is a powerful motivator.
- Knowing that others are satisfied with the organisation's leadership: It is difficult to be fulfilled if there is not open trust and support for leadership. Equally, when that open trust and support is present, it helps create an environment where people feel empowered and willing to give their full engagement.
This combination of both personal satisfaction and communication of group satisfaction is a critical distinction between Fulfilment Satisfaction and traditional definitions of satisfaction. In today's work environment, few objectives are met solely through one individual's efforts. In addition, as people work together in group settings, they are likely to influence each other's attitudes and beliefs. Because of the roles that teamwork and joint effort play in organisational success today, tapping into these elements seems critical. One might feel personally satisfied, but not perceive satisfaction in others. As a result, the overall sense of fulfilment that one feels will be diminished. Organisations that encourage open communication, where employees discuss their level of satisfaction, promotes high performance.
Studying the Relationship Between Fulfilment, Performance and Leadership
From the work above, we were able to develop a reliable and valid measure of fulfilment. However, measuring the relationship between fulfilment and business performance requires reliable measures of performance in addition to a measure of fulfilment. It is nearly impossible to identify measures of performance that are consistent across industries, or even across organisations within an industry. As a result, the relationship between satisfaction and performance was examined in 14 separate studies, with each study using a unique measure of performance.
We conducted each of these 14 studies in a similar way. For each study, we worked closely with a team from the organisation to identify existing measures of performance or devise new measures if appropriate ones did not exist. We had three criteria for the performance measures:
Table 1: Summary of Study Populations
| Company's Industry | Measures of Performance | Number of Work Units | |
1. | Savings and loan |
|
55 branches |
2. | Insurance |
|
10 agencies |
3. | Banking |
|
20 branches |
4. | Insurance |
|
14 sales units |
5. | Banking |
|
53 branches |
6. | Insurance |
|
12 agencies |
7. | Automotive sales |
|
10 dealerships |
8. | Transportation centre |
|
15 sales units |
9. | Automotive sales |
|
33 dealerships |
10. | Transportation centre |
|
13 centres |
11. | Computer manufacturing |
|
57 shifts |
12. | Technology service |
|
9 branches |
13. | Telecommunications |
|
19 sales offices |
14. | Hospitality |
|
8 hotels |
© Wilson Learning Worldwide Inc.
- The measure was meaningful to the organisation's business success
- It was measurable at the individual work unit level
- The measure had a direct impact on bottom-line performance
Table 1 summarises the characteristics of the organisations participating in these studies. The organisations were distributed across three broad industry groups: financial services (banking, S&L, insurance), manufacturing (computers and automotive) and service (transportation and hospitality). Performance measures consisted of sales revenue, profit margins, customer satisfaction, production targets, market share, quality control and repeat business. Since each organisation used different performance measures, we treated each as a separate study.
The same method was used in all studies. Fulfilment data were collected from all work unit members. Work unit performance measures were gathered for roughly the same time period as the fulfilment data. An effort was made to secure data from several performance periods (e.g., several shifts, several weeks of customer satisfaction data) to ensure reliable indicators. All employees in a work unit were involved in the study. Each work unit contained between 3–10 employees; the total study population consisted of approximately 2,000 employees across the 14 studies.
The fulfilment and performance data were submitted to a multiple regression analysis to determine the degree to which work unit performance can be predicted from the work unit's satisfaction level. Multiple regression analysis results in a value (called R) that indicates the degree of association between fulfilment and performance. The higher the R value (the closer to 1.00), the more fulfilment predicts the performance outcomes.
More About Multiple Regression
A multiple regression analysis results in a regression coefficient (R), which is an indicator of the association between satisfaction and performance. Regression coefficients have a range of -1.00 to +1.00. Values close to 0.00 indicate that the variables are unrelated. Negative values indicate that when one variable increases the other decreases. For example, as the hours of light in a day increase, the hours of darkness decrease (R = -1.00). When variables both increase, the R values are positive. For example, as the number of minutes increases, the number of seconds increases (R = +1.00). In this study all R values are positive, indicating that the two variables increase or decrease together. The higher the positive value (that is, the closer to 1.00), the stronger the relationship. For studies of this type (behaviour studies), a value between 0.00 and 0.30 indicates a minimal relationship. Any value over .30 is considered meaningful, because at this point approximately 10% of the difference in one variable is shared with a change in the other variable. Values between .30 and .60 are considered moderately strong. Values between .60 and 1.00 are considered very strong. In this study, a regression coefficient value above .60 indicates that over 35% of the difference in performance can be attributed to differences in fulfilment.
Results: Fulfilment and Performance
 The following graph shows the average R value across all 14 studies. The R value of .63 indicates that there is a very strong relationship between Fulfilment Satisfaction and the business performance measures. This is remarkable considering the number of other factors affecting business performance that are unrelated to Fulfilment Satisfaction.
Table 2: Satisfaction to Performance Multiple Regression Results
| Company's Industry | R | Percent of Variability | |
1. | Savings and loan | .63 | 40% |
2. | Insurance | .89 | 79% |
3. | Banking | .50 | 25% |
4. | Insurance | .84 | 71% |
5. | Banking | .44 | 19% |
6. | Insurance | .85 | 72% |
7. | Automotive sales | .82 | 67% |
8. | Transportation centre | .94 | 88% |
9. | Automotive sales | .32 | 10% |
10. | Transportation centre | .56 | 31% |
11. | Computer manufacturing | .49 | 24% |
12. | Technology service | .50 | 25% |
13. | Telecommunications | .38 | 14% |
14. | Hospitality | .59 | 35% |
Average | .63 | 39% | |
© Wilson Learning Worldwide Inc.
Table 2 shows the results for each of the studies individually. While the average R value was .63, the table shows that there was actually great variability among the studies. R values ranged from R = .32 (Study 9) to R = .94 (Study 8). Thus, even with the lowest R value, the studies indicate that the relationship between satisfaction and performance is at least moderately strong and, in many cases, very strong.
The majority of studies had regression coefficients between .50 and .85, suggesting that the relationship between satisfaction and performance is moderate to very strong. It is likely that different organisations and different industries will place differing emphasis on satisfaction and therefore variability among studies should be expected.
Table 2 also shows a "Percent of Variability" column. This is another statistic produced by the multiple regression analysis that shows exactly how much of the difference in performance is caused by differences in fulfilment. Thus, averaging across the 14 studies, 39% of the difference in work unit performance can be attributed to differences in fulfilment. Said in another way, the Percent of Variability can be used to predict how much performance will change if you improve a work unit's fulfilment. On average, improvement in fulfilment could increase performance by 39%.
In summary, these 14 studies indicate that there is a significant and meaningful relationship between business performance and fulfilment. The results suggest that organisations, regardless of industry, could improve organisational performance by improving fulfilment among employees.
Results: The Leader's Role in Improving Fulfilment
If organisational performance is strongly affected by employee fulfilment, as these studies indicate, then understanding what characteristics contribute to fulfilment can be critical in improving organisational success. Of the things an organisation can do to impact employee fulfilment, we focused on the day-to-day interactions between an employee and his or her manager. We hypothesised that fulfilment is largely determined by the work environment and sense of teamwork created by the leader of the work unit.
When we measured fulfilment in the 14 studies described above, we also measured employees' perceptions of their leader's actions and how those actions affected the employee. We analysed 28 separate leadership behaviours. Employees rated each behaviour in terms of the actions of their direct manager. These behaviours defined five critical leadership practices:
| Direction | Does the leader create a work environment that links the employees' actions to an important and inspiring organisational purpose or mission? |
| Goals | Does the leader define challenging but achievable work objectives for the employees? |
| Feedback | Does the leader provide information and direction needed to track and improve performance? |
| Recognition | Does the leader provide the appropriate consequences to improve and maintain high performance in the work unit? |
| Support | Does the leader show a concern for the development of employees and provide support and coaching to improve individual performance and abilities? |
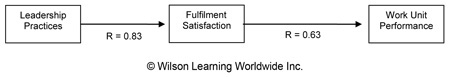 We used the same multiple regression technique to determine the relationship between leadership practices and employee fulfilment that we used to determine the relationship between fulfilment and performance. The overall result of this analysis is shown in the following graph, along with the fulfilment-performance results shown earlier. There is a very strong relationship (R = .83) between leadership practices and the Fulfilment Satisfaction of the employees.
Table 3: Leadership to Satisfaction Multiple Regression Results
| Company's Industry | R | Percent of Variability | Greatest Contributor | |
1. | Savings and loan | .78 | 61% | Direction |
2. | Insurance | .81 | 66% | Recognition |
3. | Banking | .90 | 81% | Recognition |
4. | Insurance | .81 | 66% | Support |
5. | Banking | .89 | 79% | Recognition |
6. | Insurance | .84 | 71% | Direction |
7. | Automotive sales | .81 | 66% | Support |
8. | Transportation centre | .91 | 83% | Recognition |
9. | Automotive sales | .89 | 79% | Goals |
10. | Transportation centre | .80 | 64% | Recognition |
11. | Computer manufacturing | .75 | 56% | Feedback |
12. | Technology service | .85 | 72% | Feedback |
13. | Telecommunications | .84 | 71% | Support |
14. | Hospitality | .77 | 59% | Feedback |
Average | .83 | 69% | ||
© Wilson Learning Worldwide Inc.
The results for each of the 14 studies is shown in Table 3. There was much less variability between studies in this analysis than there was in the relationship between fulfilment and performance. All of the regression coefficients were between .75 and .91, indicating that between 56% and 83% of the variability in fulfilment can be attributed to the leadership practices of the work unit's manager. On average, 69% of the variability in employee satisfaction is attributable to the actions of the work unit leader.
The multiple regression analysis also allowed us to identify the individual leadership practice in each study that contributed most to the relationship with fulfilment. These practices are also listed in Table 3 in the "Greatest Contributor" column. There was significant variation between organisations as to which leadership practice contributed most to predicting fulfilment. Each of the five practices was the largest contributor for at least one of the studies. Recognition was the one most frequently identified (five studies); Feedback and Support were also frequently identified (for three studies each), as was Direction (two studies). Goals was identified as the largest contributor in one study.
Conclusions
In a business environment that requires employees who are flexible, creative and willing to take risks, it is necessary to find ways to help employees feel fulfilled and empowered in their work.
At a time when research is showing that job satisfaction is at an all-time low (Conference Board, Towers Perrin) and that less than half of all employees feel a sense of loyalty to their organisation, Wilson Learning Worldwide's research could not have come at a better time. Our research suggests that the single biggest contributor to these feelings of fulfilment, empowerment and satisfaction lie in the day-to-day relationship between employees and their managers. These 14 separate studies show:
- Managers and leaders have the major impact on the Fulfilment Satisfaction of employees and, consequently, on how well they perform.
- Between 56% and 83% of fulfilment could be predicted from the skills and practises of the manager or leader.
- When employee fulfilment was high, so was performance; when employee fulfilment was low, so was performance.
- All 14 studies showed a significant relationship between employee fulfilment and work unit performance.
- 39% of bottom-line performance can be attributed to employee fulfilment.
Clearly, while organisational leaders are rethinking how to manage the corporation, they must also rethink how they lead the people who drive it. We found that leadership skills directly related to employee satisfaction include having a clear direction for the group; having realistic and clear objectives; and being able to give appropriate feedback, recognition, and support. Perhaps most importantly, the results emphasise empowering and developing employees so they can do the work themselves and eliminate barriers to getting the work done. Managers who have the leadership skills to accomplish these conditions will create a high level of fulfilment in their employees with a direct impact to the bottom line.
These studies suggest that a person's manager is the primary contributor to fulfilment in an organisation. Pay, compensation, work conditions, promotions and benefits are important, but are more often associated with creating dissatisfaction than with fulfilment. In other words, when people feel their salaries are not fair, work conditions are poor, or the benefits are insufficient, they feel dissatisfied with the organisation and their job. However, even if these conditions are perfect, this elimination of dissatisfaction does not mean that employees feel fulfilled, only that they no longer are dissatisfied. And it is employee fulfilment, not satisfaction, that predicts performance. It is the individual manager who creates, or fails to create, fulfilment.
Understanding the connection between business performance, leadership, and employee fulfilment can measurably impact the future competitiveness of a company. Employee satisfaction impacts the bottom line and is largely determined by employee day-to-day interactions with managers. Of all the factors an organisation can improve to impact employee satisfaction, improving individual leadership is the most effective. Those leaders who see their role as a developer of people, and who are skilled in the new leadership practices, will have high-performing employees. Managers who do not are well advised to reconsider how they lead. If a company is prepared to invest in new equipment and new processes, then why not in the company's human assets who drive those initiatives and the people who lead them.
References
"Linking Employee Satisfaction with Productivity, Performance, and Customer Satisfaction." Corporate Executive Board, 2003.
"Creating a Highly Engaged and Productive Workplace Culture." The Gallup Organisation, 2001.
"Working Today: Understanding What Drives Employee Engagement." Towers Perrin, 2003.
Beverly Kaye and Sharon Jordan-Adams, "Building Loyalty and Commitment in the Workplace." Career Systems International, 2002.
More information about the Negotiating to Yes programme is available from Wilson Learning Worldwide.
Share via:


Vous pourriez également être intéressé par la lecture
L’approche du leadership
About the Author

Michael Leimbach
Michael Leimbach, Ph.D., est Vice President of Global Research and Design chez Wilson Learning Worldwide. Avec plus de 25 ans d’expérience à son actif, Dr. Leimbach dirige la recherche et la conception des outils de diagnostic, d’apprentissage et d’amélioration de la performance de Wilson Learning. Dr. Leimbach a effectué des travaux de recherche importants dans les domaines de la vente, du leadership et de l’efficacité organisationnelle, et a développé les modèles de retour sur investissement et d’évaluation d’impact. Dr. Leimbach a également agi en tant que consultant auprès de nombreuses organisations clientes internationales, est membre du comité de rédaction de la revue professionnelle ADHR, et occupe un rôle de leadership au sein du comité technique ISO TC232: Standards for Learning Service Providers. Dr. Leimbach est co-auteur de quatre ouvrages, a publié de nombreux articles professionnels et intervient fréquemment lors de conférences nationales et internationales.

 Merci de remplir ce formulaire afin de télécharger Redéfinir la satisfaction professionnelle | Performance, épanouissement de l’employé et pratiques de leadership».


